The secrets behind Nanolive’s imaging patented technology
Classical Microscopy (e.g. fluorescence imaging)
The cell is directly imaged; so what you see on your camera is the image of the cell. Therefore, one absolutely needs to apply Nyquist sampling on the camera. But, this is NOT true for the 3D Cell Explorer. The paradigm shift to make is that there is no direct imaging of the cell on the camera.
Nanolive Imaging
Non-invasive optical nanoscopy can achieve such a lateral resolution by using a quasi-2π-holographic detection scheme and complex deconvolution. The spatial frequencies of the imaged cell do not make any sense to the human eye. But these SCATTERED frequencies are converted into a hologram and synthesize a bandpass which has a resolution DOUBLE the one normally available. Holograms are recorded from different illumination directions on the sample plane and observe sub-wavelength tomographic variations of the specimen. Nanoscale apertures serve to calibrate the tomographic reconstruction and to characterize the imaging system by means of the coherent transfer function. This gives rise to realistic inverse filtering and guarantees true complex field reconstruction.
All the math and proofs are explained in great detail in our peer reviewed Nature Photonics publication here: https://www.nature.com/articles/nphoton.2012.329.
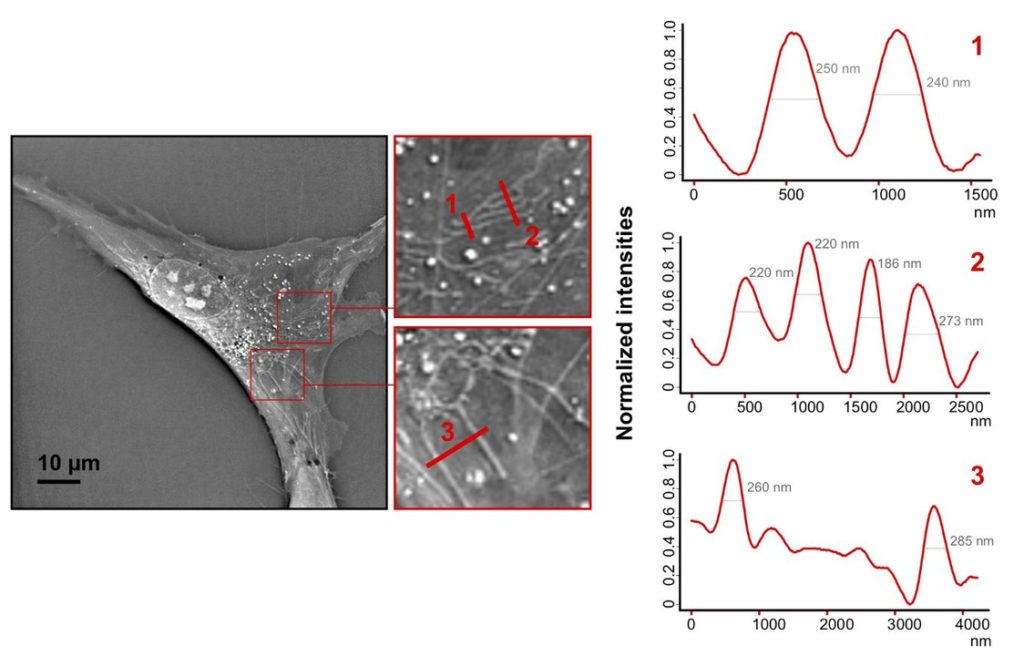
Explaining the Resolution Jump
Rayleigh resolution for incoherent light (e.g. fluo) is 400nm=0.61*520nm/(0.8), for coherent light (e.g. holography) 533nm=0.82*520nm/(0.8) with the diffraction limit (e.g. any imaging by niquist) of 325nm=0.5*520nm/(0.8). In our case for the 3D Cell Explorer configuration, the maximal expected resolution is around 160nm=0.5*520nm/(2*0.8) and we estimate the real resolution (according to Rayleigh) to be about ~190nm. Therefore, taking into account the illuminating wavelength the experimental resolution is 190nm=/lambda/(3.5 NA), indicating a sub-diffraction resolution (d=325 nm at given wavelength and NA) imaging in far-field (non-fluorescent) transmission microscopy.
In conclusion, the 2 terminologies of (i) optical resolution (the real one) and (ii) sampling resolution (the one on the screen) are separated for 3D holotomographic microscopy. For the sake of computational cost-reduction, Nanolive chose to have the sampling optimal at the optical resolution, hence about 180 nm. Again, we can do this, thanks to our technology WITHOUT loosing any real resolution, but of course a user could over-sample the images and have double/triple/etc sampling on the screen with the same optical resolution (e.g. simple zero-padding in fft space to have a smoother image).
| Properties | Standard Fluorescence | Super resolution Fluorescence | Phase imaging | Electrical impedance | SEM, AFM | |
| Preparation | ||||||
| Time | ||||||
| Simplicity |  |  | | | |  |
| Cost | ||||||
| Cell condition | ||||||
| Observation | ||||||
| Temporal sampling | ||||||
| Live Cell Imaging | ||||||
| Training-free | ||||||
| Cellular health | ||||||
| Result | ||||||
| Lateral Resolution | Below 200nm | Down to 250nm | Down to 50nm | 400 – 1000nm | No Image | 5-10nm |
| Image Dimensionality | ||||||
| Quantitative | ||||||
| Comprehensive | ||||||
| Costs | ||||||
| Price (euro) |  |
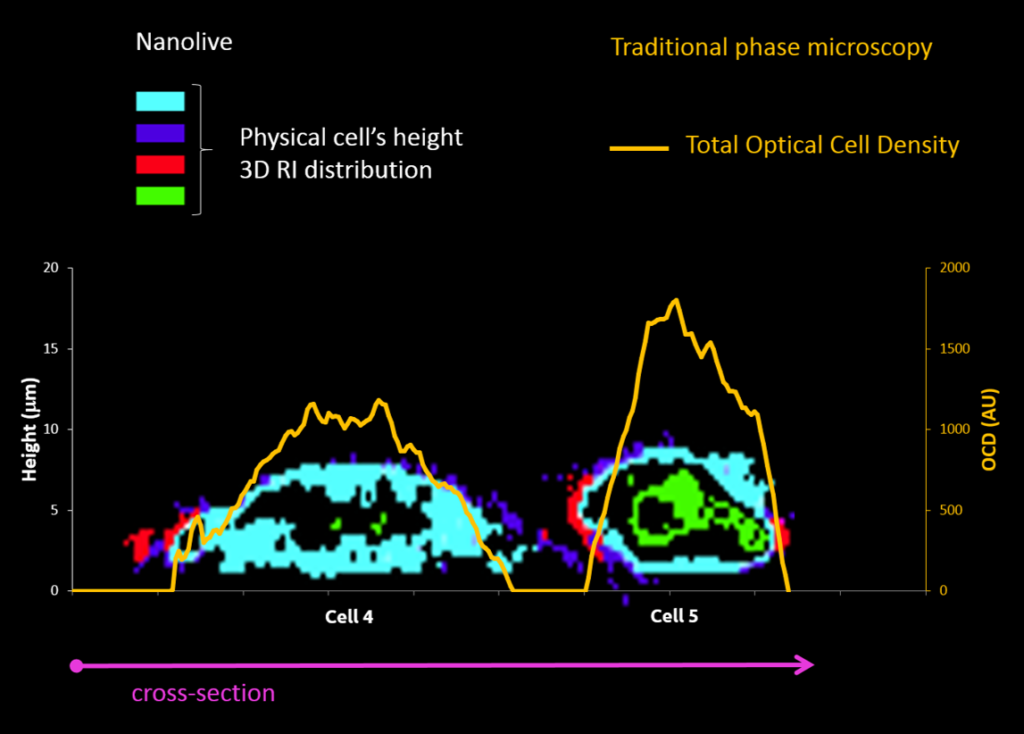
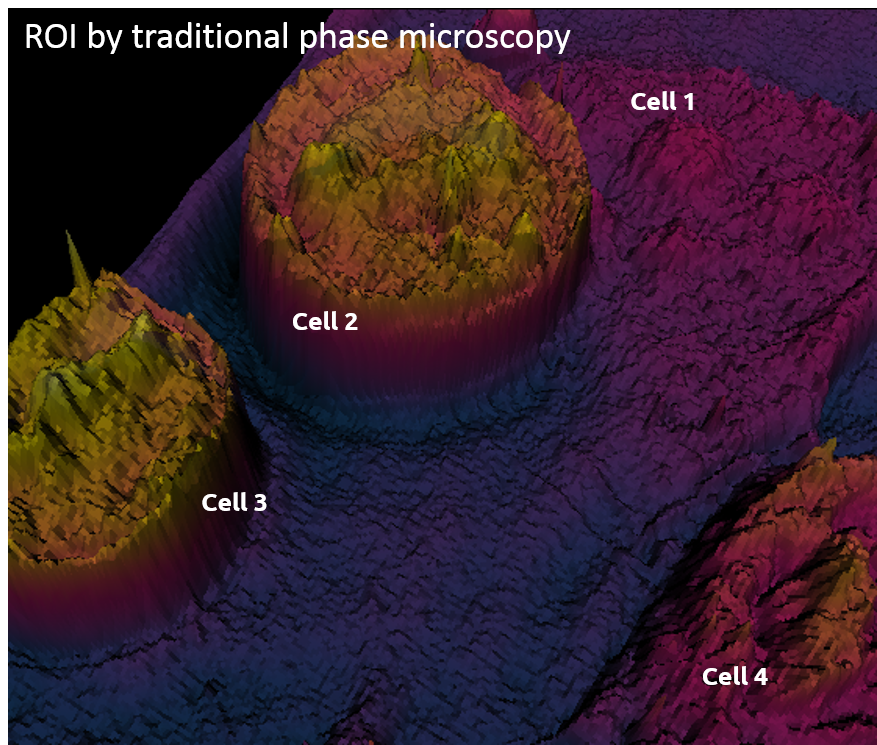
Traditional phase microscopy |
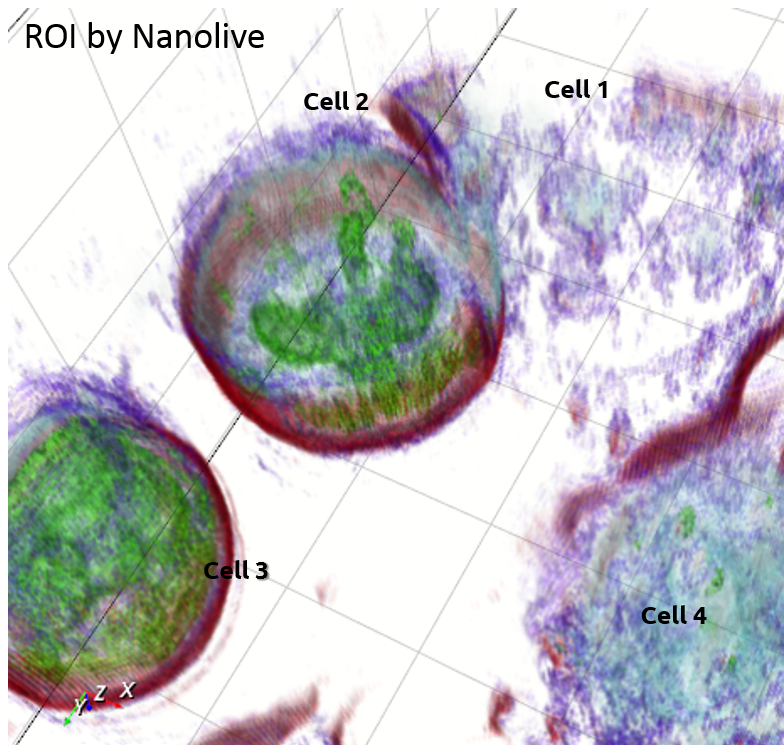
Nanolive |
 |
 |
Example of Embryonic Stem Cells (ESC) during mitosis
 |
 |
 |
| 2D RI map of mouse Embryonic Stem Cell Cells (mESC) |
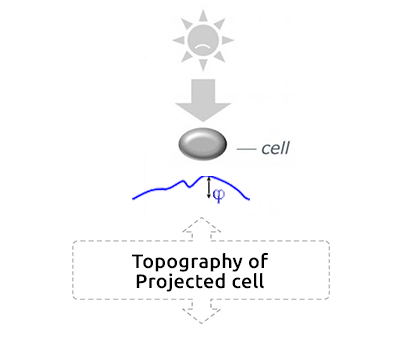
Cell projection (outside cell topography)
Total Optical Cell Density (2.5D OCD)
Resolution: 400 – 1000 nm
High noise level
|
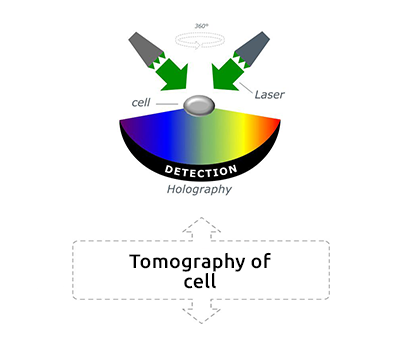
Tomographic Imaging
Physical cell’s height (3D RI distribution) 200 nm resolution Low noise ratio |
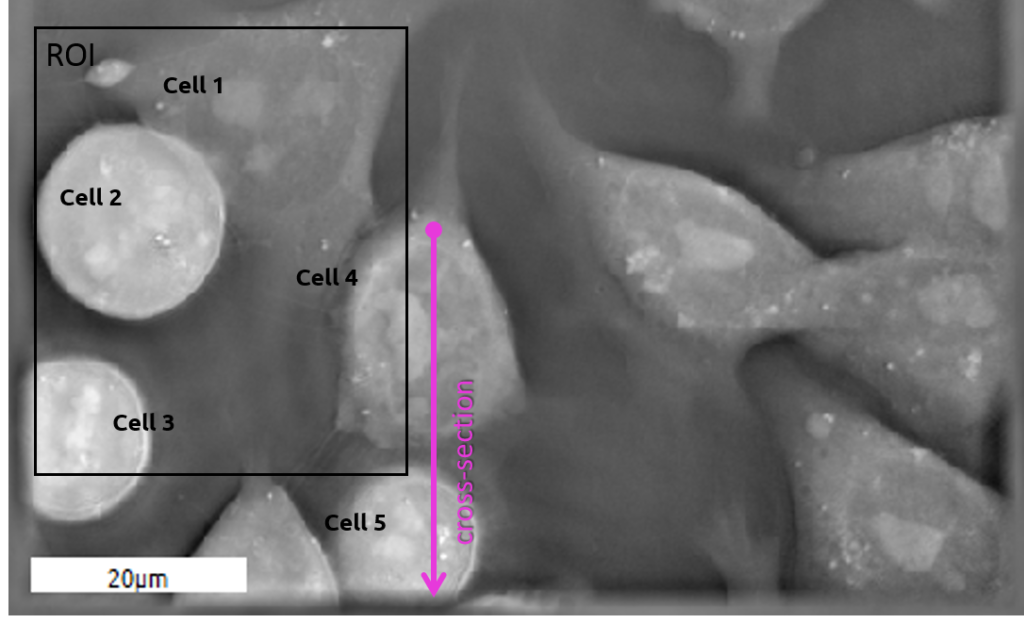
Comparison between ESCs (4 & 5) as observed with the two technologies