- controlling your transfection efficiency
- determining the cell numberand cell viability
- FDA conform proof of monoclonality
- FACS seeding control
- apoptosis monitorig e.g. in fed-batch cultures
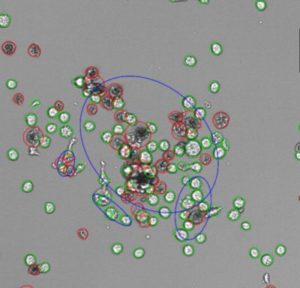
- detecting and counting colonies
- quantifying IgG levels
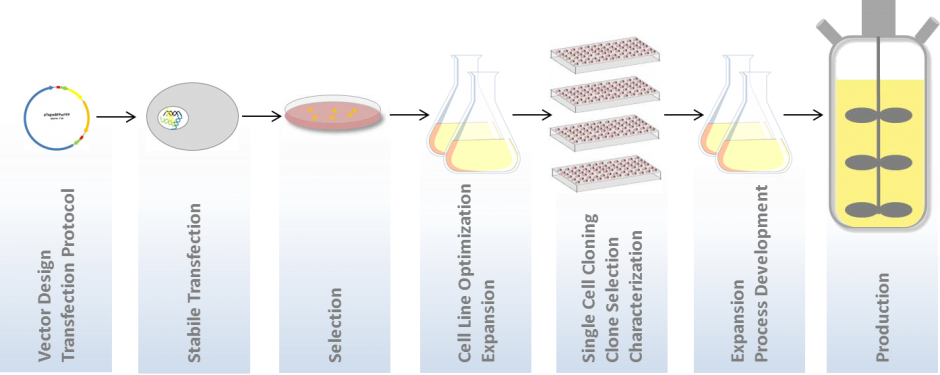
Proof Of Monoclonality – Can You Afford Not To Be Sure?
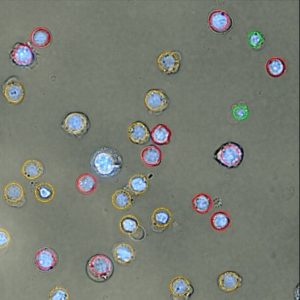
 Cultivation of cells and cell based assays often require researchers to determine the number of cells they for preparing for cellular assays. Furthermore, in routine sub-culturing, cell line development or upscale bioreactor cultivation (harvesting), it is important to control the viability of the culture. The Trypan Blue viability test is a widely used technique to determine the cell number and the culture viability. In a lot of cases this is performed manually by counting cells with a hemocytometer which is tedious and leads to subjective and biased results. Automated or semi-automated cell counters are available for this purpose and each one has individual advantages and disadvantages e.g. consumption of sample volume, cost intensiv sample disposables, long measurement durations and no automated triplicate sample-scanning.
SYNENTEC has adopted the classical Trypan Blue staining method for its NYONE® and CELLAVISTA® cell images and solves many disadvantages of other viability testing methods.
Cultivation of cells and cell based assays often require researchers to determine the number of cells they for preparing for cellular assays. Furthermore, in routine sub-culturing, cell line development or upscale bioreactor cultivation (harvesting), it is important to control the viability of the culture. The Trypan Blue viability test is a widely used technique to determine the cell number and the culture viability. In a lot of cases this is performed manually by counting cells with a hemocytometer which is tedious and leads to subjective and biased results. Automated or semi-automated cell counters are available for this purpose and each one has individual advantages and disadvantages e.g. consumption of sample volume, cost intensiv sample disposables, long measurement durations and no automated triplicate sample-scanning.
SYNENTEC has adopted the classical Trypan Blue staining method for its NYONE® and CELLAVISTA® cell images and solves many disadvantages of other viability testing methods.
- whole-well measurements in standard 96-well microplates
- significantly increasing throughput (5 minutes per 96 samples)
- small sample volumes (20 µL in total)
- exact reproducibility
- simple triplicates in one measurement
- automated image analysis and data management
- batch processing capabilities
- Viability in %
- VCD/mL
- CD/mL
- # of Aggregates/mL
- Ratio of Aggregates in %
- Avg. Cell Diameter in µm
Monitoring Viability with Trypan Blue – The Evergreen In Each Lab
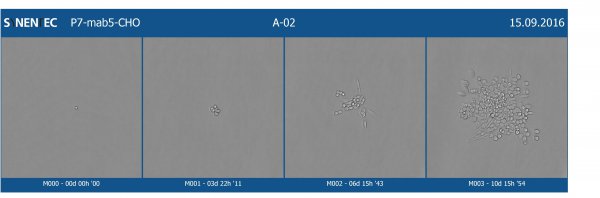
This application provides the opportunity to scan the whole well of the entire plate with one of our imaging systems in bright field at high resolution which is below 1 micron per pixel, on the first day, just after seeding the cells.
Benefit:
- fast cloning approach
- seamless stitching
- no area in the well will be missed
- automatable measurement day by day
- all colonies are recognized by our software
- tracking back to the first day to demonstrate monoclonality
- automatic generating of a clone gallery
This will give you a proof that your colony in fact grows from a single cell or – the undesired event: grew from a doublet.

2. FASCC – Overcome The Edge-Effect

Ghost cells represent one of the main challenges in cell line development and drug discovery. Those undetected cells usually lie on the well edge and can be caused by the fact that most of the common imaging systems for CLD are equipped with a low resolution optic (2 microns per pixel), combined with a white light (brightfield) source only.
This lack of resolving power causes a lack of information within the image and therefore it is hardly possible to distinguish cells from debris, or well-edge artefacts. Because of this inaccuracy, a precise statement about the monoclonality is not unambiguously possible. Adding fluorescence information to your application simplifies to detect these cells in a reliable way, even at the well edge!
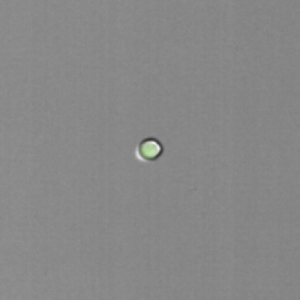
SYNENTEC has developed a unique approach (FASCC) to overcome all disadvantages of the classic white light single cell cloning. FASCC (fluorescence activated single cell cloning) provides a fully automated way of screening your micro titer plate by using the advantage of short term, non-toxic and animal-free cell staining. The proof of monoclonality is unambiguous and furthermore a faster way to perform full well scans for regulatory approval. This unique tool presents an unambiguous proof of monoclonality without guesses or doubts!
FASCC-Workflow
- a fast(1), low resolved (4x lens) high speed scanning mode (pre-scan) detect the fluorescence signal of e.g. Calcein-AM or Cell Tracker® stained cells(2)
- the embedded image analysis tool excludes all wells seeded with more than just one cell or any number of cell-count the user sets up
- in the highly resolved(3) Nanoview-scan all pre-scan results will be picked up and will be proceed by centering all single cells right in the middle of a sinlge image (benefit: no cells on stitching boarder and fast scan despite high resolution)
- over expansion-periode confluence measurement or suspension cell count with automated colony-detection can be performed to track cell proliferation
(1)The pre-scan will usually take less than 3 minutes for an entire 384-well-plate (CELLAVISTA®). (2)Both dyes are non-toxic and will disappear within 3-4 hours for Calcein-AM and within days for CellTracker. The goal of Cell Tracker and Calcein-AM is an enzymatic reaction, which induces both dyes to emit fluorescence light to indicate a viable organism. (3)The images taken at the post-scan are now highly resolved (10x lens) and are offering a detailed view inside of each cell.
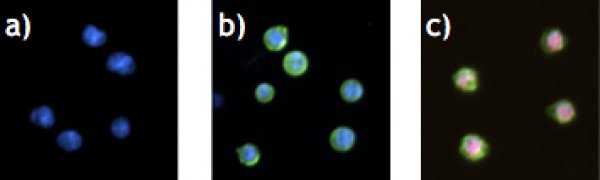
Transfection/Transduction Efficiency and Genome Editing with CRISPR/Cas9 – A Very Efficient Method
[Confluence (1F) – Suspension Cell Count (1F)]- % Confluence BF
- % Confluence FL
- % Ratio of Confluence BF/FL
- # of Cells in Brightfield
- # of Cells in Fluorescence
- # of Cells Brightfield AND Fluorescence
- # of Cells in Brightfield
- # of Cells in Fluorescence1 (AND/OR Fluorescence2) only
- # of Cells in Brightfield AND Fluorescence1 (AND/OR Fluorescence2)
- # of only Hoechst33342-stained cells (=viable cells)
- # of Hoechst33342 and AnxV stained cells (=apoptotic cells)
- # of Propidium Iodide and AnxV stained cells (=necrotic cells)
- Total # of cells
- % of Hoechst33342 and JC-green stained cells (=cells with loss of mitochondrial membrane potential
- % of Hoechst33342 and JC-red stained cells (=viable cells)
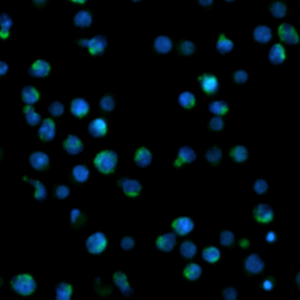 Caspases constitute a family of proteases responsible for the induction of controlled cell death. Upon activation, hydrolysis of the procaspase into active caspase occurs. Various caspases are among the critical enzymes in the apoptosis process and are well studied in the human organism. They are able to activate further procaseases and specifically hydrolyze cell substrates and structural proteins. The result of caspase activation is, among other things, the fragmentation of the cell, which ends in the formation of the ‘apoptotic bodies’.
Due to the high degree of flexibility in channel selection, this assay can be carried out in a variety of ways with NYONE® and CELLAVISTA®. You can work with or without counter stain (Hoechst). You can use 2 differently fluorescent caspase detectors simultaneously. And the simultaneous use of propidium iodide or 7-AAD as necrosis detection is also possible.
Extract from the software readout (for further information look at ShortNote Virtual Cytoplasm 1F)
Caspases constitute a family of proteases responsible for the induction of controlled cell death. Upon activation, hydrolysis of the procaspase into active caspase occurs. Various caspases are among the critical enzymes in the apoptosis process and are well studied in the human organism. They are able to activate further procaseases and specifically hydrolyze cell substrates and structural proteins. The result of caspase activation is, among other things, the fragmentation of the cell, which ends in the formation of the ‘apoptotic bodies’.
Due to the high degree of flexibility in channel selection, this assay can be carried out in a variety of ways with NYONE® and CELLAVISTA®. You can work with or without counter stain (Hoechst). You can use 2 differently fluorescent caspase detectors simultaneously. And the simultaneous use of propidium iodide or 7-AAD as necrosis detection is also possible.
Extract from the software readout (for further information look at ShortNote Virtual Cytoplasm 1F)
- # of only Hoechst33342-stained cells (=viable cells)
- # of Hoechst33342 and Caspase+ stained cells (=apoptotic cells)
- % of Apoptotic Cells
IgG-Quantitation – Sometimes Less Means More
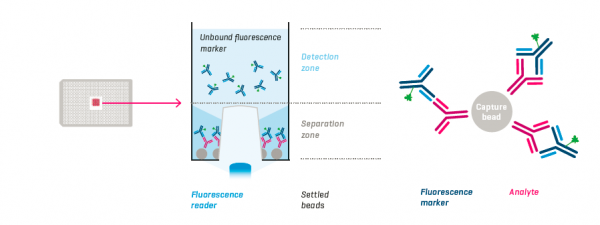
Assay Principle
Protein A coated capture beads, analyte and fluorescence markers are incubated in the wells of a 384-well PAIAplate. After sedimentation of the beads with the bound analyte-marker-complexes, the remaining unbound fluorescence marker is measured with the NYONE® or CELLAVISTA®.Features
- High throughput in 384 well plates
- processing time for full plate < 1 hour
- Low sample consumption
- 2- 10 µL of crude sample
- Simple protocols in single-use plates
- no washing , no blocking, no regeneration
- Cost-efficient (No capital expenditures)
- runs on fluorescence microscopes
Conclusion
Running PAIA IgG quantification assays on the CELLAVISTA® and NYONE® imagers allow the reliable identification of high producers with a very limited amount of samples from cell culture supernatants and high throughput. The combination of PAIA assays and SYNENTEC’s imaging systems enables to monitor monoclonality and cell growth plus the workflow is amenable to automation and offers a high throughput which can be increased to up to four 384-well plates per hour if several shakers are used in parallel.Software Readout
PAIA Biotech has developed a software tool for the rapid generation of calibration curves, calculation of sample concentrations and result exports. The data generated with our YT-analysis software® can be exported as csv-files and can be imported into PAIAs software tool. In this software tool method templates facilitate the processing of recurrent plate layouts. They contain a predefined layout with the positions of standards, controls and samples as well as their concentration and dilution factors. The measured fluorescence intensities are copied from the instrument and pasted into the tool, calibration curves are generated, and heat maps provide a quick result overview. Different report and export functions for QC data, results and graphs are implemented.